Optimizing International Allocations with Asia
Going forward, we believe that the traditional international allocation and global emerging markets deserves a rethink.
"Internet services companies, online entertainment, application software, electric vehicles…are examples of industries where we see innovation and secular growth today."
Traditionally, public equity allocations made by investors reflect their home biases. In the U.S., we have seen up to 75% or more of an investors’ portfolios allocated to U.S. companies, either through direct investments and/or a managed portfolio. The remainder of their public equity allocation has typically gone offshore into an allocation of developed international equity strategies such as EAFE (Europe, Australasia, and the Far East) combined with a much smaller allocation to global emerging markets (EM) using either an active manager or an ETF (exchange traded fund).
Going forward, we believe that the traditional international allocation to EAFE and global emerging markets deserves a re-think.
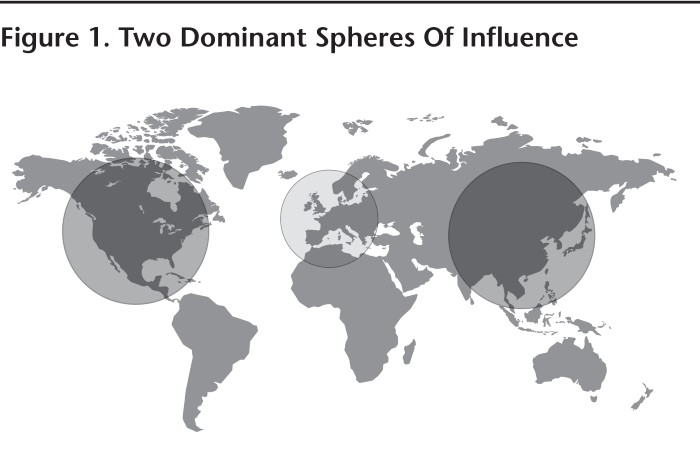
Historical returns, economic growth rates, current and forward looking corporate earnings, capital market development momentum, future index representation, shifts in discretionary spending and consumption, and leadership changes in global innovation all point towards Asia replacing Europe as the second sphere of influence in global equities (the first sphere being the United States).
As such, in our view, current international equity asset allocation models (such as EAFE) which are typically biased towards financials, industrials and other cyclically oriented businesses could benefit from an equal allocation to the advanced economies of Asia—plus China—in order to add growth, innovation and exposure to new “total addressable markets.”
The Advanced Economies of Asia
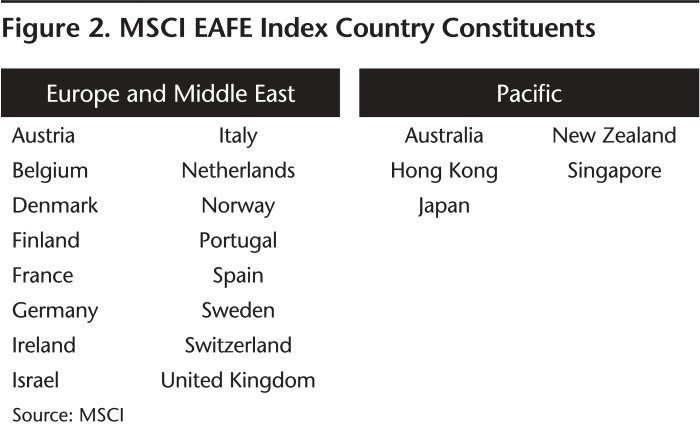
An allocation to EAFE is meant to provide investors with exposure to the world’s most advanced economies outside the United States. An advanced economy is a term used by the International Monetary Fund (IMF).While there is no established numerical convention to determine whether an economy is advanced or not, having a high level of per capita income, a very significant degree of industrialization, a varied export base and a financial sector that's integrated into the global financial system are generally used to define an advanced economy.
As of 2020, the IMF categorized 39 nations as advanced economies. Within Asia, economies considered developed or advanced include Japan, Singapore, Hong Kong, Australia, New Zealand, South Korea, Taiwan and Macau. While several markets on this list—Japan, Singapore, Australia and New Zealand—are EAFE constituents, investors could also consider the economies of South Korea, Taiwan, and even China, as advanced economies meriting inclusion in their international allocations given their investment grade status and higher levels of development and governance.
Three Reasons to Include the Advanced Economies of Asia within a Developed International Allocation
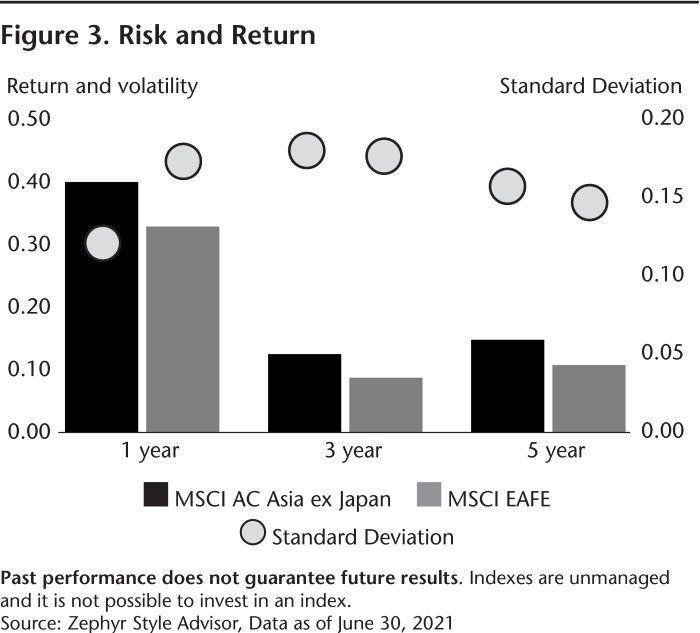
First, let’s succumb to our primal instincts as investors and admit to the importance of returns.
Asia (as measured by the MSCI AC Asia ex Japan Index) has outperformed EAFE (as measured by the MSCI EAFE Index) over the one-, three- and five-year periods (as of June 30, 2021) without adding much in terms of volatility making Asia additive in terms of asset allocation.
Secondly, as investors, we need to recognize the rapid evolution of a second sphere of influence in global equities.
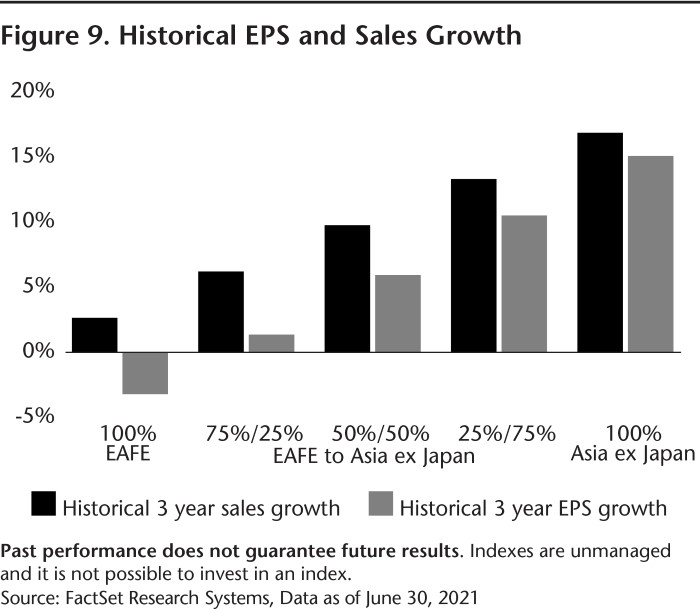
The first sphere of influence within global equities is, and will likely continue to be, the United States. Historically, the second sphere has been Europe, implemented through portfolio allocations to EAFE. However, we would argue that the drivers of international returns are moving east—and moving east very quickly. We believe the second sphere of influence is now Asia. It is not only because of the massive size of Asia’s economies, or the growth and the increasing size of its capital markets— although it is true that Asian equity markets, especially China, are growing significantly faster than European markets. But what is also evident is that Asian companies have more attractive fundamental metrics in aggregate.
Historical three-year earnings per share (EPS) growth and historical three-year sales growth have been higher in Asia than EAFE (as of June 30, 2021). Additionally, forecasted three year EPS growth is higher in Asia. Quality metrics like return on equity (ROE) and return on Assets (ROA) are currently higher in Asia than EAFE (as of June 30, 2021). And valuations in Asia are currently slightly lower than EAFE!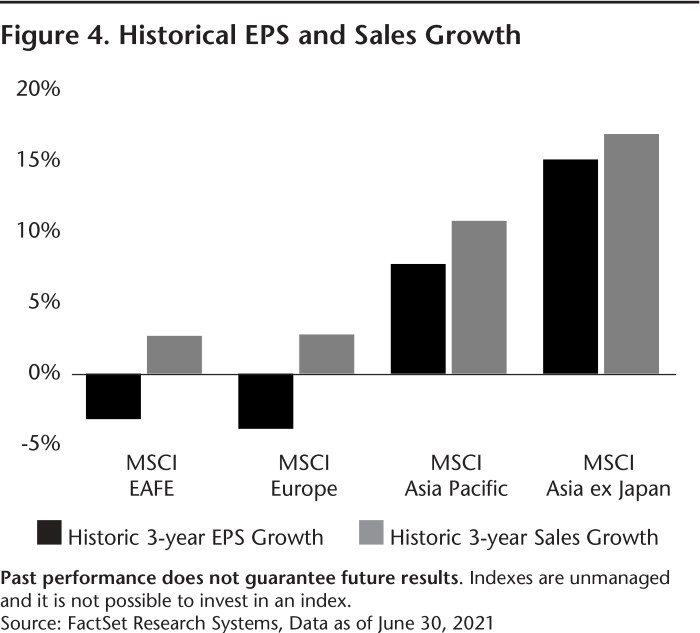
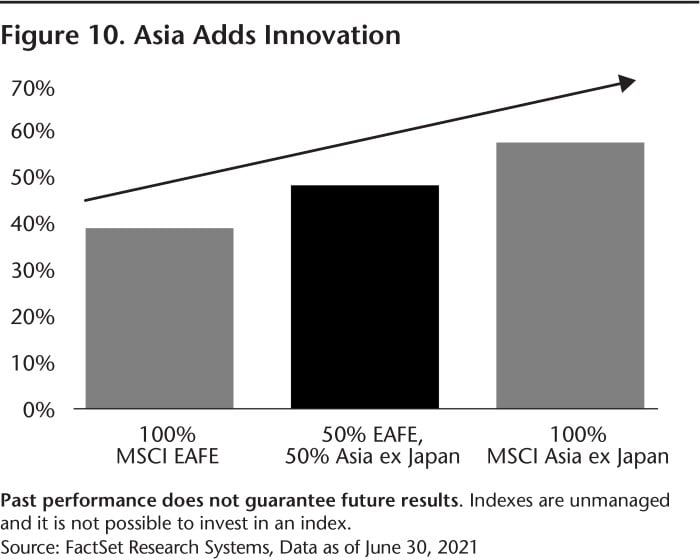
The third reason why we believe investors should consider adding advanced Asian markets to their international allocation is the importance of innovation.
Why is capturing innovation such an important theme? While “innovation” may sound like a cliché or a passing fad like many “mega trends,” in reality, innovation has been the major structural driver of Asian equity returns and Asian economies. Innovative sectors such as information technology (IT), health care, communication services and consumer discretionary have been the best performing and the largest contributors to Asia ex Japan and EM equity returns—both over the short and long term. In fact, the returns of innovative sectors have been almost double the returns of the Asia ex Japan benchmark over the 10-year period (as of June 30, 2021).
As allocators, we always need to ask ourselves, will this investable trend continue? We think it will. In fact, we think the innovation theme in Asia is just beginning.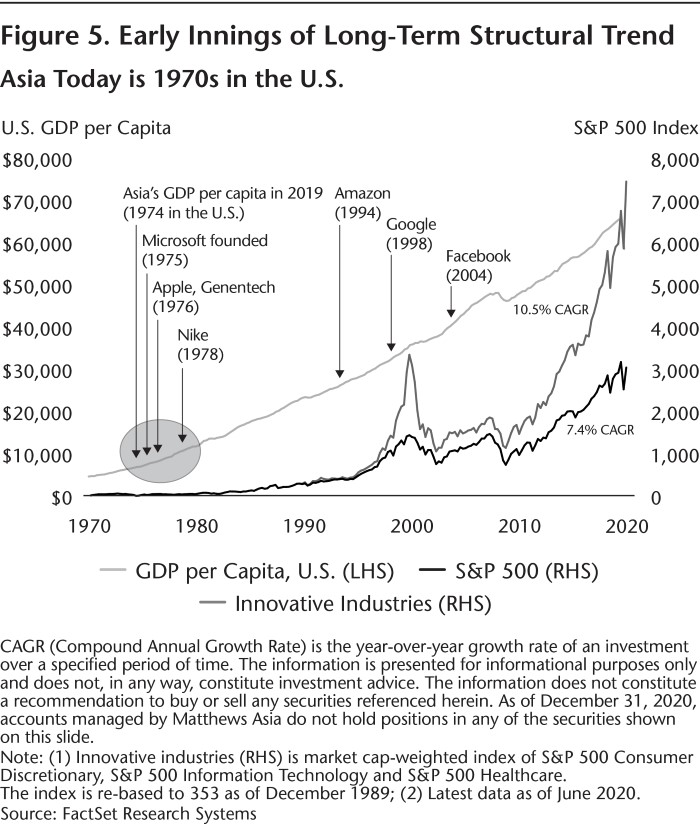
We equate Asia’s stage of innovation today to what the U.S. was like in the 1970s through the 1990s. Imagine if you could have purchased U.S. innovation via companies like Microsoft, Genentech and Apple back in the late 1980s. We believe Asia’s stage of development, buying power and consumer preferences all point to a similar path of demand for innovation.
Asia’s Total Addressable Market
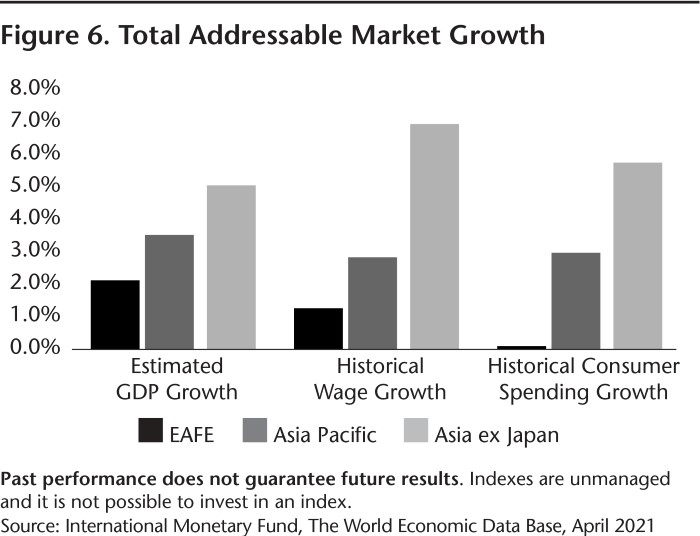
But why own Asian innovation and growth if it can be found in the U.S. or Europe? In our view, the potential scope of wealth creation in Asia and its trajectory of discretionary spending—especially in China—likely cannot be replicated anywhere in the world. Asia’s total addressable market (the total market demand for a product or service) and the growth and spending power of its consumer base differentiates Asia’s investment potential versus other markets like EAFE. To put Asia’s total addressable market into perspective, let’s begin by visualizing ground zero: Asia’s population of approximately 3.5 billion versus the Eurozone of approximately 500 million. Secondly, visualize Asia ex Japan’s massive workforce growing its wages at an average of 7% per annum. Lastly, imagine those higher wages leading to consumer spending growth of over 5.5% per annum versus almost zero consumer spending growth in the largest EAFE countries in Europe.
The impact of Asia’s growth in discretionary spending supported by almost inconceivable total addressable markets, higher wages and savings has led to strong tailwinds within many secular growth industries—with incumbent leaders and emerging leaders which investors can consider today. In short, we believe Asia has the key ingredients for innovation-led growth for the next generation.
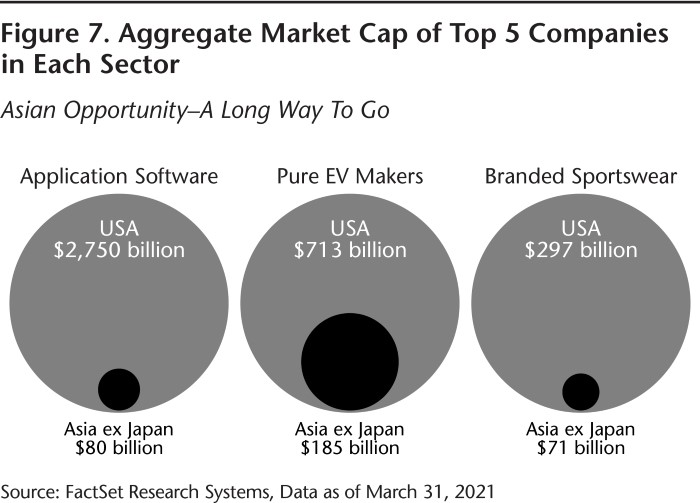
What are examples of innovative industries with secular growth tailwinds? Health care is undoubtedly one area, not just biotech but also device companies, medical services and pharma. Internet services companies, online entertainment, application software, electric vehicles, branded sportswear, cosmetics, and of course fintech are all further examples of industries where we see innovation and secular growth today.
Creating a Well-rounded International Allocation with Asia
As investors, how can we structure international investments to capture the cyclical, value orientation of Europe while at the same time investing in the higher growth and innovation of Asia—all while improving quality (return on assets and return on equity) and maintaining a high level of developed and advanced market exposure?
One idea would be to consider adding exposure to the advanced economies of Asia, plus China, to complement developed international EAFE exposure. For example, an allocation of 50% EAFE and 50% Asia ex Japan would result in the following blend of exposures and improved metrics:
- Return Metrics
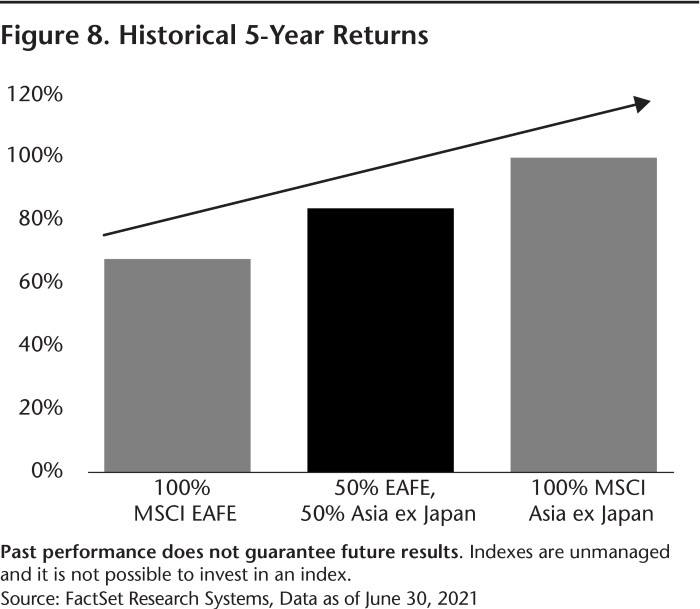
Asia ex Japan has outperformed EAFE in 1-, 3-, 5-, 10- and 20-year periods (as of June 30, 2021).
A 50% MSCI EAFE and a 50% MSCI AC Asia ex Japan allocation would have added roughly 2.70% per annum to an EAFE only return over the last five years.
- Growth Metrics:
The MSCI AC Asia ex Japan Index has stronger historical and estimated growth metrics than the MSCI EAFE Index. We believe adding Asia ex Japan exposure would help diversify and potentially increase the growth profile of an EAFE allocation.
- Increased Innovation:
Earlier we discussed the importance of innovation. We believe that innovation should be a core allocation instead of a thematic trade—especially given innovative sectors’ history of outperformance. Adding Asia ex Japan to an EAFE allocation significantly increases innovation, especially within information technology and communication services in our view.
- A Better Balance of Cyclicality, Growth and Value:
We believe a reasonable allocation to cyclicality may add necessary balance to a portfolio, especially in times of economic recovery or perceived inflationary pressure (such as the first half of 2021 as an example). A 50/50 allocation between MSCI EAFE and MSCI AC Asia ex Japan provided almost a third of the portfolio allocation to more cyclically, value-oriented holdings.
Conclusion
Within international equities, a somewhat synchronized post COVID- 19 global economic recovery has allowed markets to become more balanced whereby overextended growth stocks within highflying sectors have corrected. Concurrently, undervalued, cyclically oriented stocks have re-rated higher after years of underperformance. Going forward, as economic growth and monetary policy begin to normalize, international equity returns should revert away from macro influences towards stock specific, company fundamentals. Investors can potentially take advantage of 2021’s factor rotation by re-constituting their international equity allocation in favor of improved growth metrics and increased exposure to the drivers of innovation while maintaining an allocation to value-oriented names.
Adding Asia, especially the advanced economies of Asia, including China, is an adjustment which historically would have added to returns and increased diversification. Looking forward, this adjustment could not only make allocation sense, but would also increase exposure to the rising second sphere of influence in global equities—Asia.
As of July 31, 2021, Matthews Asia portfolios held no positions in Microsoft Corp., Genentech, Inc. and Apple Inc.
There can be no guarantee that any strategy (risk management or otherwise) will be successful. All investments involve risk, including potential loss of principal. Past performance is no guarantee of future results.